
1. Select "Time Heat Maps" from "My Reports" on the left-side menu.

2. Select your desired date range. Adjust the time period as desired using the drop-down date menu at the top of the page. Choose one of the preset time periods or select "Custom Range" to select a unique range.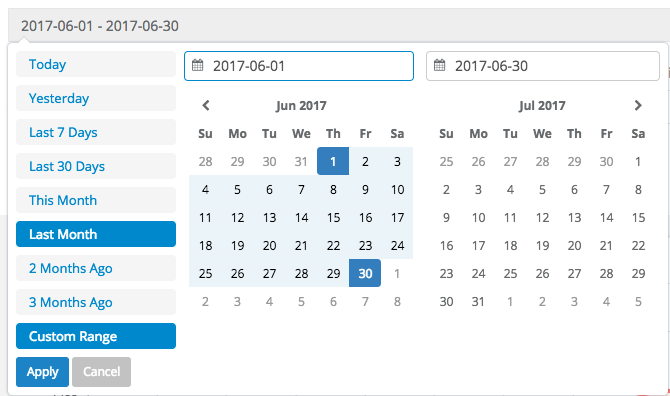
3. Select Filter: Group, Activity Type, or Employee.
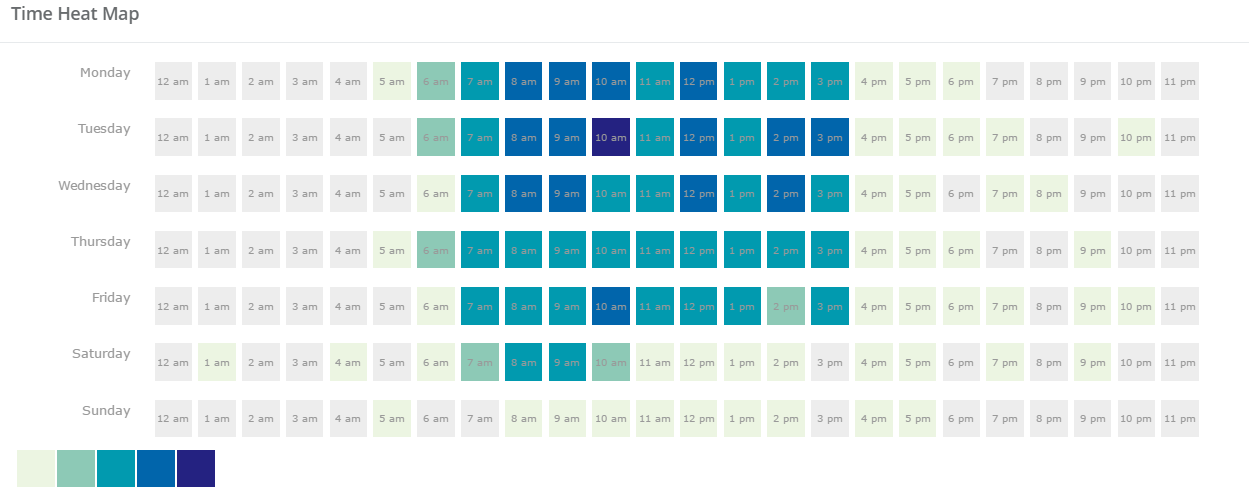
4. The report will show you how many phone calls were received by day and hour for the selected date range. The darker the square, the more calls were received at that time.
Example: For the date selection 5/1/17 to 5/31/17 shown below, the report displays the volume of phone calls received every Monday from 5 AM to 6 AM and so on. If you hover over the square, it will display the exact number of calls made during the time that box represents. 10 AM to 11 AM on Tuesdays is the busiest time.
Comments
0 comments
Article is closed for comments.